


Select a language
In December 2015, 195 members of the United Nations Framework Convention on Climate Change agreed to “limit the temperature increase to 1.5 °C above preindustrial levels” in the Paris Agreement. For several cities in Europe, home to millions, the 1.5°C threshold has already been reached. An exclusive investigation by the European Data Journalism Network (EDJNet) shows that in the Nordic and Baltic regions, in much of Andalusia and in South-Eastern Romania, average temperatures in the 21st century were already much warmer, sometimes by several degrees, than in the 20th century, already affecting the life expectancy of Europeans, their health and well-being.The 1.5°C temperature increase is a global target and areas that are warming faster are not off-track from this goal; scientists have expected for decades that polar regions would warm more than areas closer to the equator.
In Granada, Cordoba and Málaga, all Andalusian cities, the average yearly temperature in the 21st century was at least 1.5°C higher than in the 20th century. In Bucharest, the capital city of Romania, temperatures increased by 1.4°C. The increase relative to preindustrial levels, a period often considered to be 1850–1900, is likely higher. By contrast, cities on the Atlantic coast saw the least amount of warming.
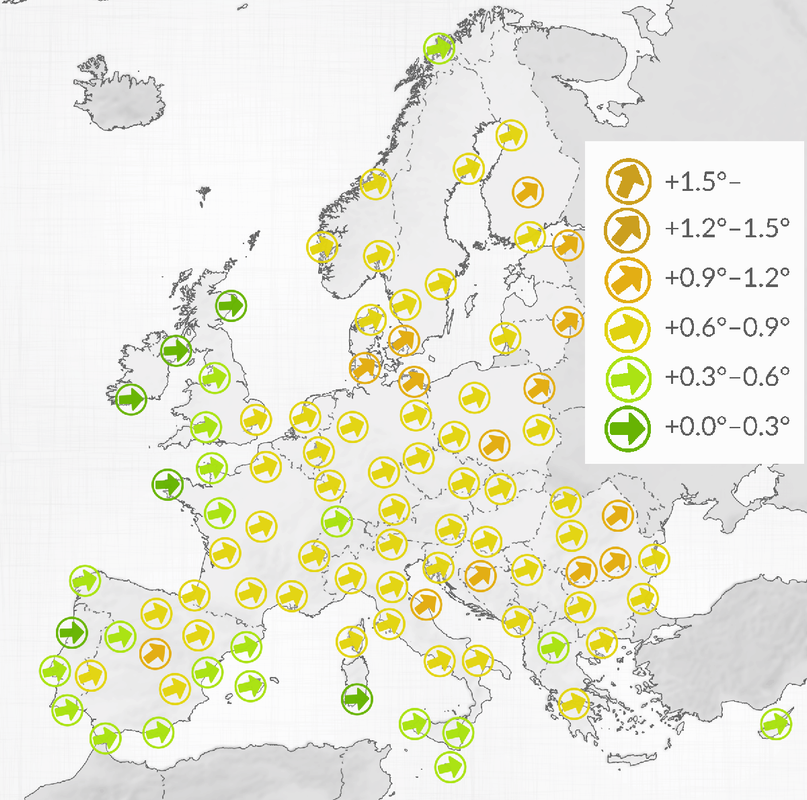
The arrows show how much the temperature increased since last century, in selected cities, in six steps; from a very small increase (green, horizontal arrow), to a very large increase (red, almost vertical arrow). Not all cities in the analysis are displayed.
These findings are the result of an analysis of over 100 million data points made available by the European Centre for Medium-Range Weather Forecasts (ECMWF), an international organisation which computes so-called “re-analyses” of weather data, based on a variety of sources such as weather stations, weather balloons, buoys and satellite observations. This is the first time reanalysis data has been made easily accessible on this scale. Such data is well-suited to study weather patterns over periods spanning over a century, because it harmonizes inputs from thousands of data sources and makes comparisons in time and space possible. While absolute values might differ from data collected at weather stations directly, especially because cities experience the “heat island effect”, meaning that temperatures within the cities can be up to 10°C higher than in their surrounding countryside, the overall trends are the same.
Looking at daily data, EDJNet was able to show how the number of hot and cold days varied over the last 117 years. In Split for instance, the second-largest city in Croatia, the number of days where the average temperature reached 27°C went from less than one per year in the 20th century to 14 per year in the 21st. Conversely, the number of cold days decreased in most cities. In the Latvian capital Riga, the number of days where the average temperature was below -1°C went from 75 per year in the last century to 57 in the 21st. Such detailed information allows for a precise assessment of the local impact of temperature change.
Heat effects on health, crime and cognitive abilities
Even limited to a couple of degrees or less, temperature increases can have severe consequences, said Mojca Dolinar, head of the department of climatology at the Slovenian Environment Agency, a government outlet. A hotter atmosphere can absorb more water before releasing it in the form of rain, she explained. This implies that periods between rainy episodes become longer and droughts more severe. On the other hand, rainfall, because of the higher concentration of water in the atmosphere, tends to be more concentrated, leading to more severe floods.
Higher temperatures, especially heat waves, were responsible for several thousands deaths since 2000. The 2003 heat wave resulted in over 70,000 extra deaths in the western half of the continent. Despite the enactment of national heat plans in several countries, a review of the link between heat and mortality in 9 European cities showed that, although excess mortality decreased in Paris, Rome and Athens since 2003, higher temperatures still cause excess deaths, not only in southern cities. Nordic cities are more vulnerable to heat stress than those already facing heat regularly. In Madrid, for instance, mortality (relative to non-hot days) increases when the average daily temperature exceeds 21°C, against 19°C in Stockholm.
Excess mortality caused by the so-called “Lucifer” 2017 heatwave, during which temperatures rose above 40°C in the Balkans, Italy and Spain, and by the 2018 heatwave in Northern Europe has yet to be analyzed by national health authorities or by academics.
Heat waves are most deadly but higher temperatures affect Europeans in other ways. Researchers have shown that pupils perform less well, especially in mathematics, when the daily average temperature rises above 22°C. In 415 of the 558 cities analyzed by EDJNet, the number of school days per year with an average daily temperature over 22°C increased in the 21st century, relative to the 20th. In Seville for instance, pupils suffered from an average of 12 school days over 22°C per year in the 20th century. This number doubled to 24 per year in the 21st century. The consequences of a hotter environment on the academic performance of European pupils have not yet been assessed.
Criminologists have known since the 1980s that, in the United States at least, violent crime increases with temperature. In Europe, despite rising temperatures, no national crime agency or academic has tried to replicate the analysis.
Rail and road transport are also affected by rising temperatures, as tarmac softens the roads to the point that some of them need to be closed during especially hot days. Rail transit within cities (overground trains and trams) can suffer from rail buckling as the metal of the rail expands and becomes unstable. This can cause delays and, as happened in the Washington D.C. underground in 2012, derailments.
Despite the higher temperatures have had on European cities, it is hard to see concerted, concrete adaptation efforts being carried out locally. Some national climate change plans conflate the fight against climate change with adaptation to higher temperatures. Climate change can only be contained by keeping hydrocarbons in the ground and capturing carbon from the atmosphere (neither option has produced any result so far), whereas adaptation to higher temperatures means ensuring that human settlements remain livable under a changing climate. National plans are often limited to regulatory instruments, such as incitative taxation for renewable energy. When it comes to creating green spaces to limit the heat island effect and, therefore, mortality from heat waves, to upgrading the local transport network to make it more resilient to heat or to installing cooling devices in classrooms, cities are on their own.
In the coming weeks EDJNet will publish a series of stories on the local impact of the rising in temperatures in specific European cities, and investigate if and what kinds of measures local authorities and other stakeholders are preparing to mitigate the adverse effects of increasing temperatures. Browse the cities reports.
METHODOLOGY
Re-analysing weather data since 1900
We have analyzed two data sets from the European Centre for Medium-Range Weather Forecasts (ECMWF), ERA-20C for the period 1900–1979 and ERA-interim for the period 1979–2017.
Both data sets are so called re-analysis, which means that ECMWF scientists used observations from a variety of sources (satellite, weather stations, buoys, weather balloons) to estimate a series of variables for squares of about 80 kilometers in side width (125 kilometers for ERA-20C). While weather stations offer a much better record for immediate daily observations, using the ECMWF re-analyses is much more adequate for the study of long-term trends. Weather stations might move, or the city might expand around them, making their data unreliable when looking at centennial trends. However, the ECMWF data does not take into account micro-climates or “heat island” effects, so that the actual weather in the streets of Baia Mare was probably one or two degrees warmer than the values reported here (the trend, however, is the same).
Analysis and reporting was done by the European Data Journalism Network (EDJNet). Partners include OBC Transeuropa (Italy), Voxeurop (France), Alternatives Economiques (France), Spiegel Online (Germany), EUobserver (Belgium), LocalFocus (Netherlands), Pod črto (Slovenia), BiQdata (Poland), J++ (Sweden), Askanews (Italy), Internazionale (Italy), NRC Handelsblad (Netherlands), El Confidential (Spain), H-Alter (Croatia), Ouest-France (France), MobileReporter (Italy), Newsworthy (Sweden), Público (Portugal), and Capital (Bulgaria).
Do you like our work?
Help multilingual European journalism to thrive, without ads or paywalls. Your one-off or regular support will keep our newsroom independent. Thank you!